COCO Caption Classification
Results dashboard for caption matching with CLIP
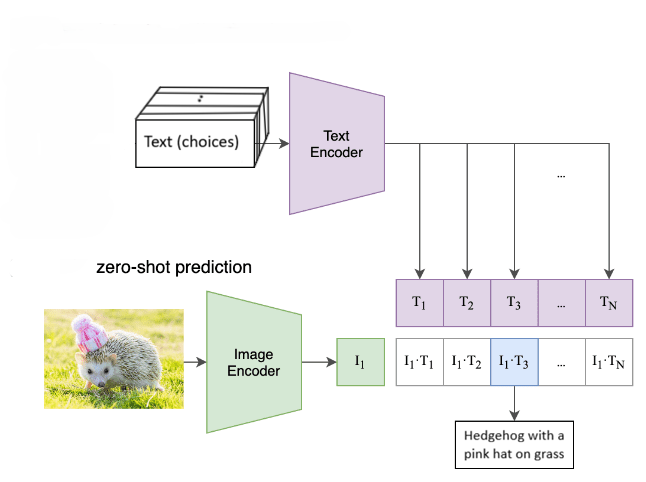
Zero-shot and few-shot performance on a curated COCO subset with 12-caption candidate sets. The model selects the single correct caption against 11 distractors.
Release artifacts
models/best_rn50_8shot.pthmodels/best_vit_b32_8shot.pthdocs/plot/*.jsonPlotly curves
Dataset processing
Curated COCO subset for caption matching with strict train and evaluation separation.
- Source: COCO subset metadata at
coco_subset_images/coco_multimodal_subset.json. - Input: 1 image + 12 candidate captions (1 correct, 11 distractors).
- Splits: k-shot removal for
k={0, 8}preserves test integrity. - Normalization: CLIP-specific mean and std per backbone.
Model configuration
Reference settings used for training and evaluation discussions.
Dataset
- Subset dir:
coco_subset_images - Images:
coco_subset_images/images - Metadata:
coco_multimodal_subset.json - Distractors: 11 (N=12 total captions)
Training
- Epochs: 25
- Batch size: 32
- Learning rate: 3e-4
- Weight decay: 0.01
- Label smoothing: 0.2
- Dropout: 0.6
- Early stop: patience 2, min delta 0.002
- k-shots: 8 (current demo)
Models
- Backbones: ViT-B/32, RN50
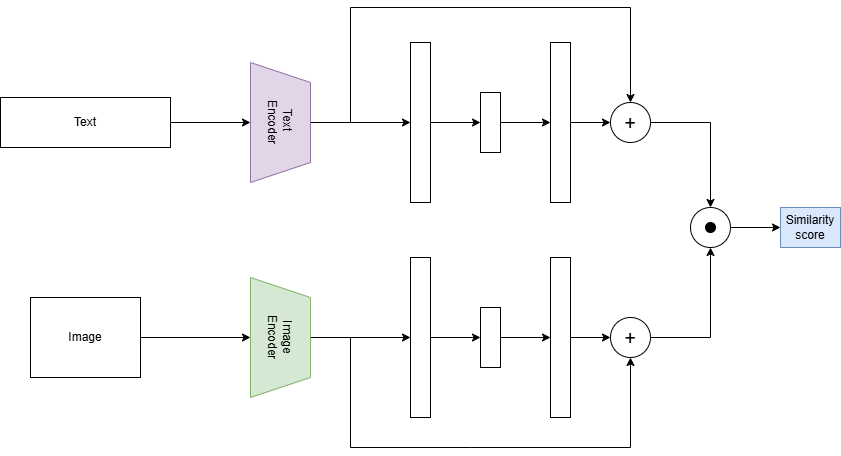
- Adapters: residual dual (image + text)
- Trainable params: 65,536 to 262,144
- Checkpoints:
models/best_*.pth
Tracking
- Device: cuda
- WandB project: coco_caption_classification
- WandB entity: thailearncoding-ho-chi-minh-university-of-technology
- Eval set: 11,640 samples
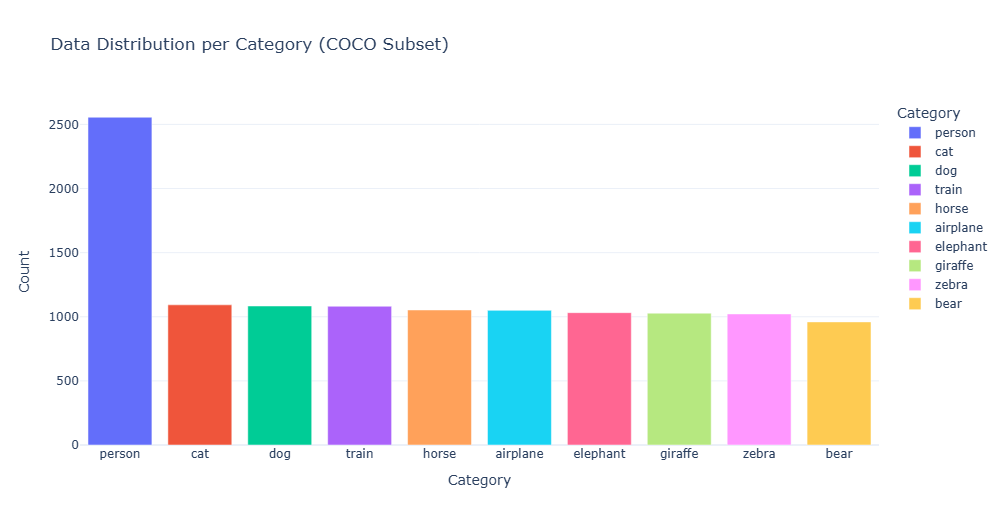
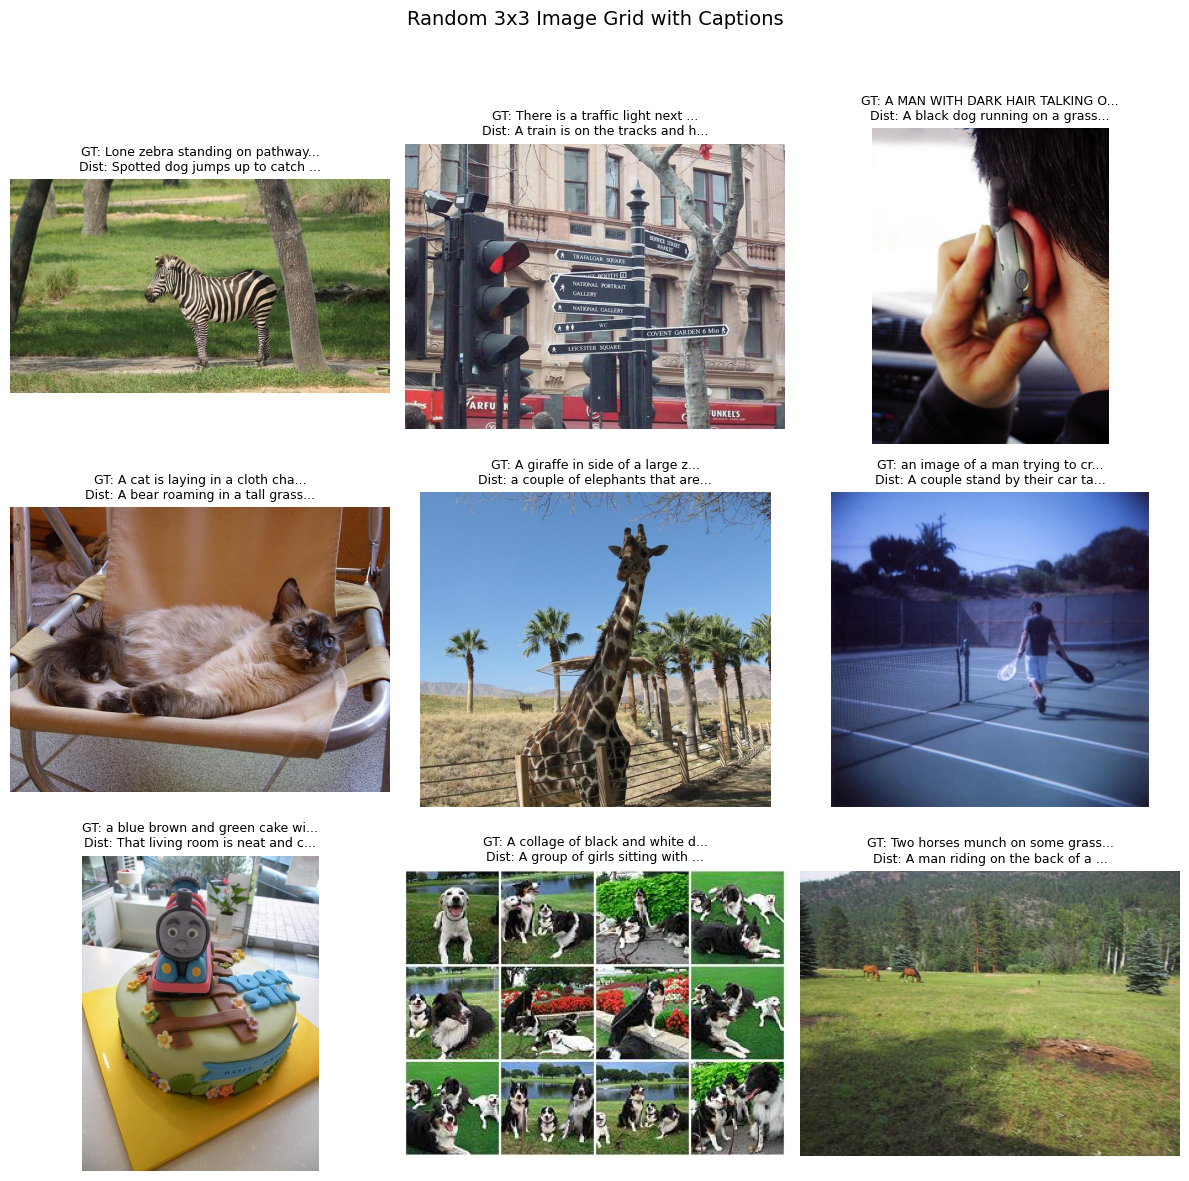
Exploratory data analysis (EDA)
Category distribution and sample pairs from the curated subset.
Data distribution
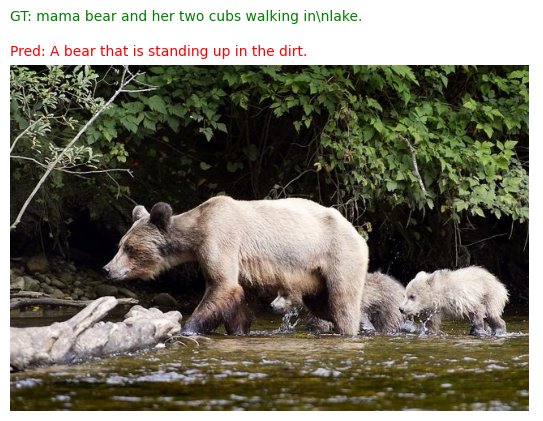
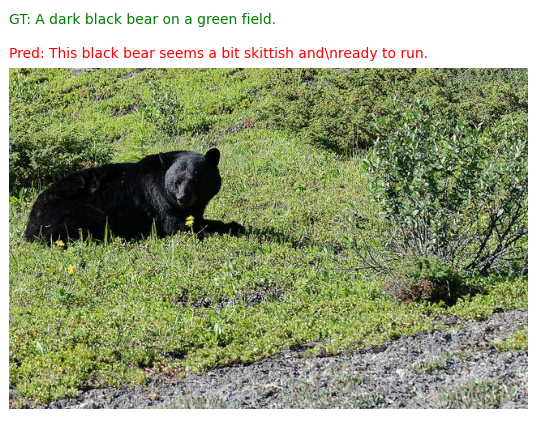
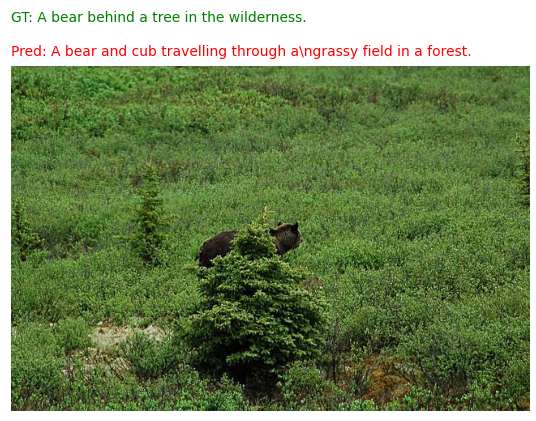
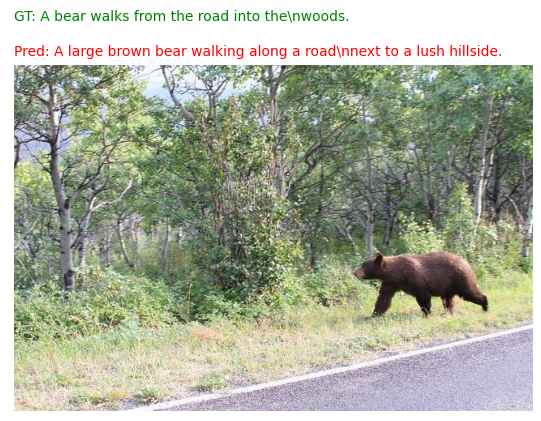
Samples with captions
Model architecture
Frozen CLIP backbones with residual adapters for few-shot alignment.
Training phase (loss curves)
Training curves per model (loss, train accuracy, eval accuracy, and F1 scores).
Evaluation
Zero-shot and 8-shot results across backbones.
RN50 backbone on 11,640 samples.
ViT-B/32 with 8-shot adapters.
Avg per sample (ViT-B/32, 8-shot).
Lightweight residual adapters only.
Model comparison
| Model | Shots | Mode | Accuracy | F1 Macro | F1 Micro | F1 Weighted | Time (s) | Time / Sample (ms) |
|---|---|---|---|---|---|---|---|---|
| RN50 | 0 | Zero-shot | 0.901718 | 0.901566 | 0.901718 | 0.901697 | 153.556601 | 13.192148 |
| RN50 | 8 | Few-shot | 0.891924 | 0.891877 | 0.891924 | 0.891938 | 152.817952 | 13.128690 |
| ViT-B/32 | 0 | Zero-shot | 0.899656 | 0.899521 | 0.899656 | 0.899657 | 143.099318 | 12.293756 |
| ViT-B/32 | 8 | Few-shot | 0.900000 | 0.900034 | 0.900000 | 0.900013 | 142.681351 | 12.257848 |
Evaluation curves by model
Each plot groups metrics for a single backbone across k-shot values.
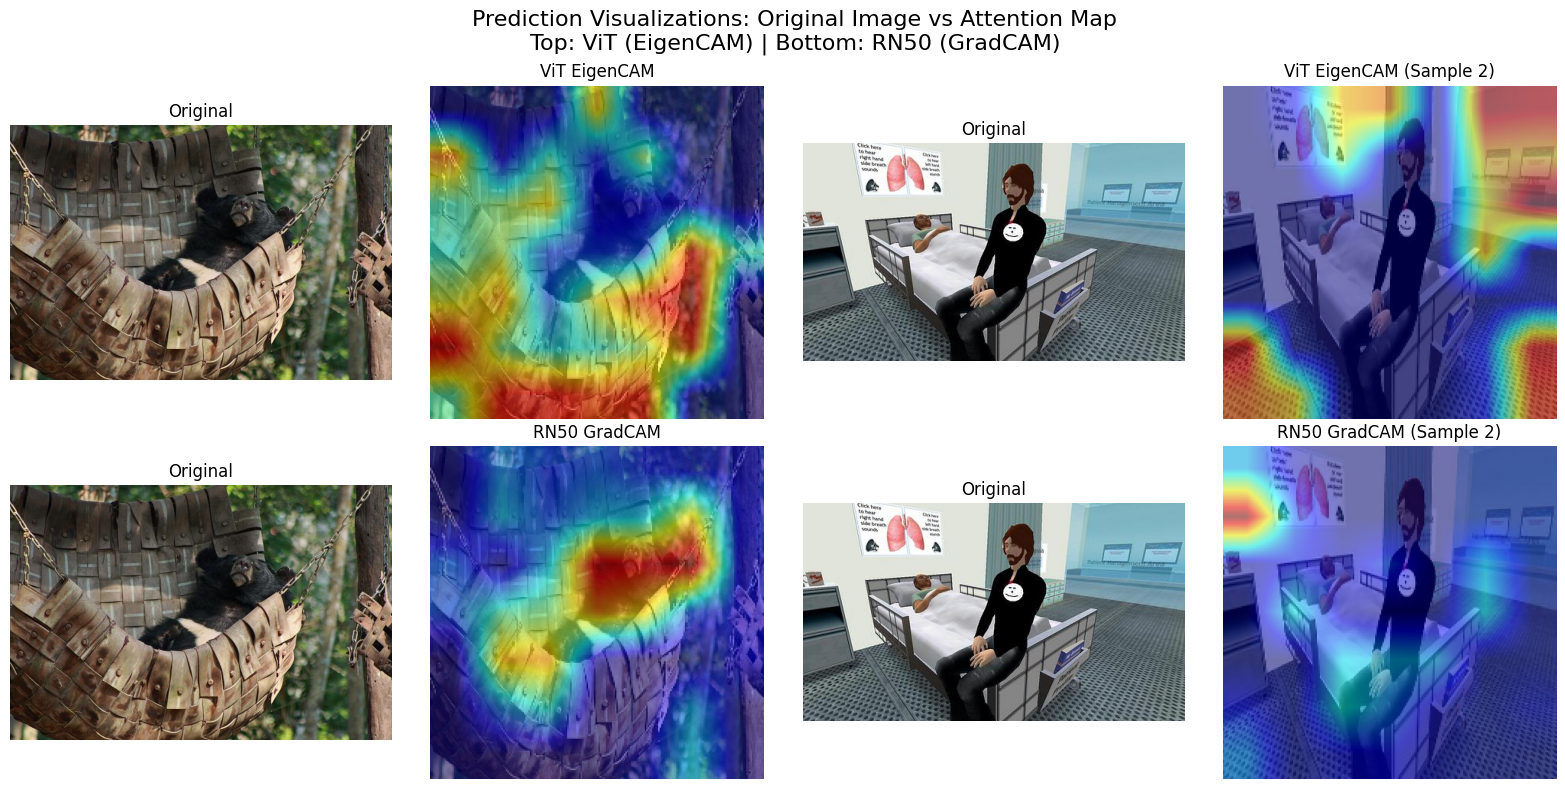
Attention maps
GradCAM and attention rollouts show where the model focuses.
Hard cases
Misclassified or ambiguous samples for error analysis.